NUMBERS DON’T LIE: 10 graphs that tell 11 years of Richard Byarugaba at NSSFHow much can good leadership achieve? Many a people had always argued that managing Uganda’s National Social Security Fund (NSSF) was just like talking a walk in the park- afterall the monthly contributions were mandated by law. But NSSF manager after manager failed to complete this simple walk in the park.
Many of them failed to complete their terms, largely to poor management and subsequently poor performance. Others are serving prison terms due to integrity issues. It was not until 2010, and the appointment of banker, Richard Byarugaba that the elusive security in social security returned to the Fund as these infographics show.
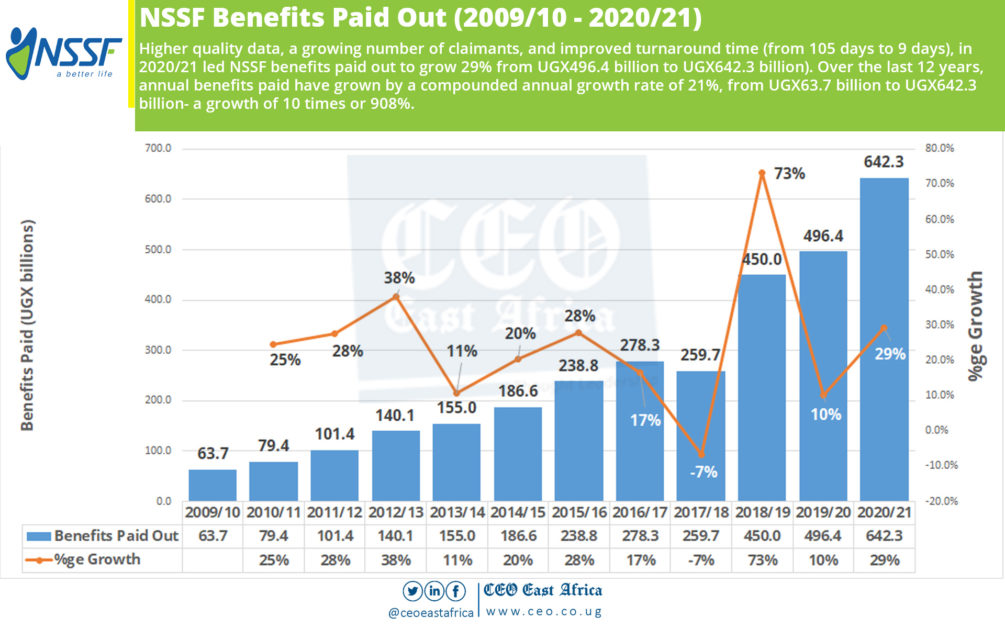
MEMBER CONTRIBUTIONS: With an economy reeling from the effects of 2 Covid-19 related lockdowns and depressed economic growth, NSSF still registered an 8% growth in member contributions, from UGX1.27 trillion to UGX1.37 trillion, 3 percentage points better than the 5% growth rate in 2019/20. In the 12 years, to 2020/21, NSSF annual member contributions have grown nearly 5 times (364%) from UGX294.7 billion in 2009/10 to UGX1.37 trillion (UGX114 billion per monthly), a compounded annual growth rate (CAGR) of 14%. ASSETS UNDER MANAGEMENT: Buoyed by increasing member contributions and subsequently the investments therefrom, assets under management grew 17% from UGX13.3 trillion in 2019/20 to UGX15.6 trillion in 2020/21. This is slightly below an impressive CAGR of 20% over the last 12 years, largely due to the Covid-19 pandemic. Overall, in the last 12 years, 11 of which have been under Richard Byarugaba, assets under management have grown 9 times (814%), from UGX1.7 trillion in 2009/10 to UGX15.6 trillion.TOTAL INCOME: On the back of a 15% growth in interest income (from UGX1.4 trillion to UGX1.6 trillion) and a 20% growth in dividend income (UGX62.3 billion to UGX75 billion), NSSF’s total income grew by 15% from UGX1.5 trillion to UGX1.7 trillion. Over the last 12 years, total income grew nearly 13 times (1159%) from a trifle UGX134.7 billion in 2009/10 to UGX1.7 trillion in 2020/21- a CAGR of 23%. So phenomenal has been NSSF’s income growth that in 2018/19 for the first time in the history of the Fund, NSSF income overtook annual member contributions as the key driver of fund growth. Income hit UGX1.26 trillion while annual member contributions reached UGX1.2 trillion.NET PROFIT: Increasing income coupled with a declining cost to income ratio (1.06% in 2020/21) led to a 31% growth in the Fund’s net profit- from UGX1.16 trillion to UGX1.52 trillion- a growth of UGX357 billion! Over the last 12 years, annual net profit has grown by nearly 12 times, at a steady CAGR of 23% to reach UGX1.52 trillion in 2020/21, from UGX132 billion in 2009/10- a growth of 1048%!INTEREST PAID: Improved profit performance has led to better interest paid to members. In 2020/21, interest paid to members, grew 31.4%, from UGX1.15 trillion to UGX1.52 trillion. Over the last 12 years, total interest credited to members’ accounts as earnings has grown 17 times (1600%) from UGX89.2 billion to UGX1.52 trillion- a CAGR of 27%.BENEFITS PAID: Higher quality data, a growing number of claimants, and improved turnaround time (from 105 days to 9 days), in 2020/21 led NSSF benefits paid out to grow 29% from UGX496.4 billion to UGX642.3 billion). Over the last 12 years, annual benefits paid have grown by a compounded annual growth rate of 21%, from UGX63.7 billion to UGX642.3 billion- a growth of 10 times or 908%.TOTAL MEMBER FUNDS & RESERVES: Solid performance over the years, saw the NSSF Total Member Funds & Reserves, reach a new high of UGX15.5 trillion, 16% up from UGX13.22 trillion in 2019/20. Over the 12 years, total member funds and reserves, grew 9 times (802%) from UGX 1.7 trillion to UGX15.4 trillion- a CAGR of 20%.INTEREST RATE: In 2020/21 NSSF paid members an interest rate of 12.15% which is 6.4 percentage points above the 10-year average inflation rate. In line with its promise of maintaining member fund value- the Fund has in the last 12 years, consistently paid above the 10-year average inflation rate including the period between 2011/12 and 2013/14 when inflation skyrocketed.CUSTOMER SATISFACTION: In line with the 2024/25 agenda of achieving a customer satisfaction rating of 95%, customer satisfaction in 2020/21, was 86%—a 2 percentage point drop from 88% the previous year. Regardless of the drop, overall, customer satisfaction has improved from 49% in 2011/12, reaching a high of 92% in 2016/17 before averaging at 86% thereafter.STAFF SATISFACTION: In line with the Fund’s target to achieve a 95% staff satisfaction rating, in 2020/21 staff satisfaction reached 94%. Overall, there has been a year-on-year improvement in staff satisfaction, all the way from 2010/11 when satisfaction was 60%.
Muhereza Kyamutetera is the Executive Editor of CEO East Africa Magazine. I am a travel enthusiast and the Experiences & Destinations Marketing Manager at EDXTravel. Extremely Ugandaholic. Ask me about #1000Reasons2ExploreUganda and how to Take Your Place In The African Sun.